It seems that C++ programming can be cumbersome for some users. Well, OTB allows you to work also in other programming languages as for instance Python. The Pylab Project which gathers numeric and scientific Python packages such as NumPy, SciPy and Matplotlib is considered as having the same features as some commercial scientific environments. Some people consider that Pylab is even more powerful than these commercial tools, since you get for free the power of a full featured and general purpose programming language as Python.
Recently I needed to quickly plot the temporal profiles of several pixels coming from temporal image series in order to easily assess the impact of a correction algorithm. I have to admit that my first idea was to generate simple ASCII files with the pixel values and then feed these files to Gnuplot. However, I found a more elegant (at least from my point of view) way to do this.
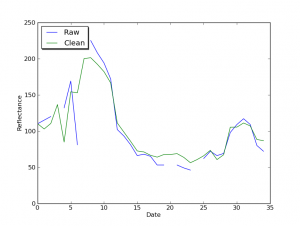
I use the OTB Python bindings in order to read my images (2 GeoTiff files with 49 bands each). Using the “GetPixel” method, I access the pixels I want to plot. Finally I use pylab to plot 2 temporal profiles (before and after correction). Here goes the code.
import sys

if( len(sys.argv) != 5):
    print("Usage: "+sys.argv[0]+" series1 series2 x0 y0")
    exit()

import itk
import otbImages
import otbIO
import pylab

# Types

ImageType = otbImages.VectorImage[itk.D, 2]
ReaderType = otbIO.ImageFileReader[ImageType]

# Pixel coordinates

index = itk.Index[2]()
index[0] = int(sys.argv[3])
index[1] = int(sys.argv[4])

# Import first series
readerBefore = ReaderType.New()
readerBefore.SetFileName(sys.argv[1])
readerBefore.Update()

pixBefore = readerBefore.GetOutput().GetPixel( index )

# Import second series
readerAfter = ReaderType.New()
readerAfter.SetFileName(sys.argv[2])
readerAfter.Update()

pixAfter = readerAfter.GetOutput().GetPixel( index )

# Chek that both series have the same length

if( pixBefore.GetSize() != pixAfter.GetSize() ):
    print("Series have different lengths")
    exit()

# Plot

vectorBefore =
 [pixBefore.GetElement(i) for i in range(pixBefore.GetSize())]
vectorAfter =
 [pixAfter.GetElement(i) for i in range(pixAfter.GetSize())]

pylab.xlabel("Date")
pylab.ylabel("Reflectance")
pylab.plot(vectorBefore, label="Raw")
pylab.plot(vectorAfter, label="Clean")
pylab.legend(loc='upper left', shadow=True)
pylab.show()
And here you can see a result example.
Of course, you can imagine to make this script a little bit more interactive in order to choose other pixel coordinates, etc., but I hope you grasp the power of this approach. By using the OTB Python bindings and other freely available open source Python goodies (NumPy, SciPy, Matplotlib, rpy) you get the user friendly approach of Octave, Scilab and their commercial counterparts plus the power of OTB (which in turn makes available ITK, OSSIM, etc.).
Isn’t it great?
